
Grade-ulator
Welcome to my Grading Calculator project page! This project was designed to simplify the process of tracking and predicting grades for students while adhering to key software engineering practices. I followed a structured approach, incorporating requirements gathering, user story development, and detailed design diagrams to create a user-friendly tool. The calculator allows users to input course details, current grades, and future assignments to calculate overall grades and predict outcomes effectively.

Stage 1--
Understanding Reqirements
To clarify the requirements and direction of the Grade-ulator, I created user stories and acceptance criteria. Each story defined specific features from the user's perspective, outlining what was needed and why. The acceptance criteria set measurable standards for success, ensuring that each feature met the intended functionality and user needs. This approach helped align the development process with the project’s goals.
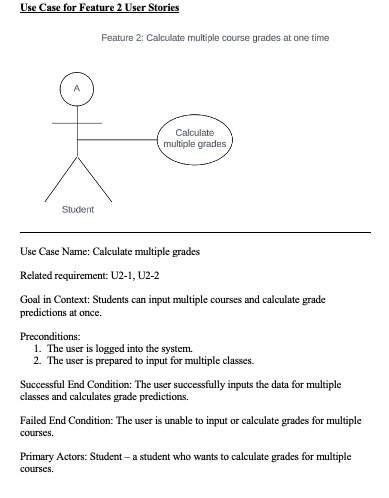
Stage 2--
Creating Use Cases
I created detailed use cases to map out the key interactions between users and the grading calculator. Each use case focused on specific actions, such as entering course information, calculating grades, and predicting outcomes. By defining the steps a user would take in various scenarios, I was able to ensure the application’s functionality would meet real-world needs. These use cases helped identify potential challenges and allowed for a more intuitive user experience, providing a clear framework for the development process.
Stage 3--
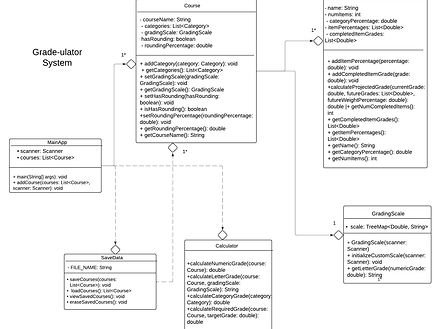
Class Diagram
I used Lucidchart to create detailed class diagrams for the Grade-ulator, which helped visualize the application's structure and relationships between key components. Lucidchart allowed me to easily map out the classes, their attributes, and methods, ensuring that the design was organized and cohesive. The diagrams provided a clear representation of how different parts of the application interacted, making it easier to identify potential issues early on and ensuring that the code would be maintainable and scalable. This tool played a crucial role in translating the project's requirements into a structured, logical design.
Stage 4--
Activity Diagram
I created activity diagrams to visually represent the flow of tasks within the Grade-ulator application. These diagrams mapped out the steps users would take to interact with the system, from entering course details to calculating grades. By outlining the sequence of actions and decision points, the activity diagrams helped clarify the process flow and identified any potential bottlenecks, ensuring a smooth and intuitive user experience. This step was essential in understanding how the different components of the application would work together.

Stage 5--
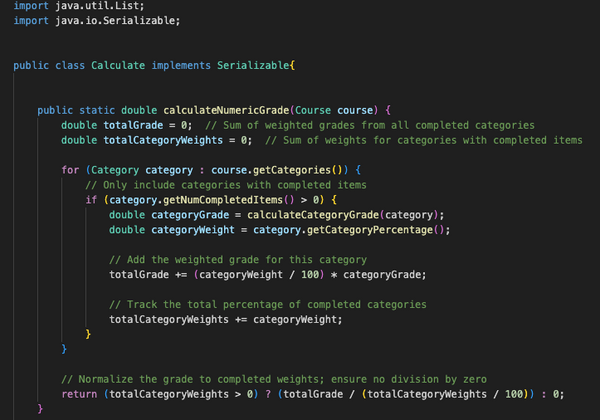
Implementation
Finally, it was time to implement! The Grade-ulator was developed in Java, following the requirements outlined in the previous stages.
Stage 6--
Testing
After completing the Grade-ulator, I swapped applications with a fellow classmate to test their project. I wrote a set of test cases to thoroughly evaluate their application, ensuring it met the specified requirements and functioned as expected. The test cases covered various scenarios, including edge cases and typical user interactions, to verify the app’s performance and reliability. This process not only helped identify potential bugs or areas for improvement in their application but also allowed me to gain valuable feedback on my own project through peer testing.
